Gap analysis data
Data created for the publication “Environmental gap analysis to prioritize conservation efforts in eastern Africa”.
Summary
Countries in eastern Africa have set aside significant proportions of their land for protection. But are these areas representative of the diverse range of species and habitats found in the region? And do conservation efforts include areas where the state of biodiversity is likely to deteriorate without further interventions? Various studies have addressed these questions at global and continental scales. However, meaningful conservation decisions are required at finer geographical scales. To operate more effectively at the national level, finer scale baseline data on species and on higher levels of biological organization such as the eco-regions are required, among other factors.
In a study described in the PLoS ONE publication “Environmental gap analysis to prioritize conservation efforts in eastern Africa”, we adopted a recently developed high-resolution potential natural vegetation (PNV) map for eastern Africa as a baseline to more effectively identify conservation priorities. We examined how well different potential natural vegetations (PNVs) are represented in the protected area (PA) network of eastern Africa and used a multivariate environmental similarity index to evaluate biases in PA versus PNV coverage. We additionally overlaid data of anthropogenic factors that potentially influence the natural vegetation to assess the level of threat to different PNVs.
Our results indicate substantial differences in the conservation status of PNVs. In addition, particular PNVs in which biodiversity protection and ecological functions are at risk due to human influences are revealed. The data and approach presented here provide a step forward in developing more transparent and better informed translation from global priorities to regional or national implementation in eastern Africa, and are valid for other geographic regions.
As part of this study a number of data layers have been created, representing human influence factors, geographic and environmental coverage of the potential natural vegetation types and hotspots for conservation. All layers presented in the paper can be downloaded below as geo-tif raster files, which can be used in virtually any GIS (geographic information system) software.
Acknowledgement
The data presented was created as part of the Ph.D. project ‘Changing habitats under future climates’ funded by a grant from the Danish Consultative Research Committee for Development Research (FFU-Danida) under project 10-095-LIFE. The funders had no role in study design, data collection and analysis, decision to publish, or preparation of the manuscript.
Terms of use
This data set with layer listed below is made available under the Open Database License. Individual layers of the data set are licensed under the Database Contents License. The recipient of the data will provide a full and appropriate acknowledgement and citation in any materials or publications derived in part or in whole from the data, using the citation mentioned below.
Citation: van Breugel P, Kindt R, Lillesø¸ J-PB, van Breugel M (2015) Environmental Gap Analysis to Prioritize Conservation Efforts in Eastern Africa. PLoS ONE 10(4): e0121444. https://doi.org/10.1371/journal.pone.0121444
The data raster layers are provided as compressed (zipped) geotifs. Also included are a metadata file, which includes the citation information and a brief description. The information is provided as-is, and does not come with any warranty or guarantee of any kind. For any publications making substantial use of the data, we welcome the opportunity for co-authorship, collaboration and to comment prior to publication. We would furthermore appreciate any feedback or information about how the data is being used (Contact us).
GIS data layers
Please find below the data layers used to create the figures presented in the paper presented above. All maps are geotif raster layers, with map projection Africa Albers Equal Area Conic (AEA; EPSG 102022). For more details, see the enclosed metadata files.
Crisis potential natural vegetations
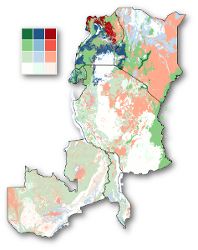
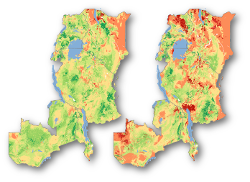
The map groups the potential natural vegetation types (PNVs) in 12 classes, based on their conservation risk and environmental bias. There are four classes of conservation risk: CR) critically endangered, EN) endangered, VU) vulnerable, and NV) not vulnerable. The environmental bias is a measure of how close the environmental conditions in the protected areas are to the median conditions in the whole PNV. The map distinguishes three classes: High bias (HB); medium bias (MB), slight or no bias (LB).
- Used for: Figure 7A main text
- Download: Click here 12MB
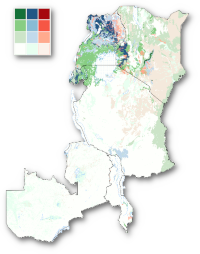
The map groups the potential natural vegetation types (PNVs) in 12 classes, based on protected areas of IUCN class Ib-IV. There are four classes of conservation risk: CR) critically endangered, EN) endangered, VU) vulnerable, and NV) not vulnerable. The environmental bias is a measure of how close the environmental conditions in the protected areas are to the median conditions in the whole PNV. The map distinguishes three classes: High bias (HB); medium bias (MB), slight or no bias (LB).
- Used for: Figure 7B main text
- Download: Click here 11.6MB
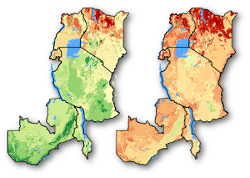
Distribution of the human influence index
A map of the human influence in eastern Africa (HI)
- Units: standardized score between 0 (no influence) and 100 (maximum influence)
- Used for: Figure 5A main text and Figure 1 in Appendix S3
- Download: Click here 34.2MB
Map of the average human influence by potential natural vegetation type (PNV).
- Units: standardized score between 0 (no influence) and 100 (maximum influence)
- Used for: Figure 5B main text
- Download: Click here 12.6MB
Accessibility index (AI), an indicator of the human influence, expressed as the relative travel time to the nearest area with a human population densities/1000 people/\(km^{2}\).
- Units: standardized score from 0 (maximum travel time, no influence) to 100 (no travel time, maximum influence)
- Used for: Figure 1 in Appendix S3
- Download: Click here 154.8MB
Travel time to the nearest area with a human population densities/1000 people/\(km^{2}\).
- Units: hours
- Used for: Used to compute the Accessibility index (AI), see above.
- Download: Click here 236.4MB
Livestock grazing pressure (LPI), an indicator for the influence of livestock on the natural vegetation. Expressed as the ratio of livestock feed requirement and feed availability
- Units: standardized score between 0 (no influence) and 100 (maximum influence)
- Used for: Figure 1 in Appendix S3
- Download: Click here 80.1MB
Vegetation cover change (VTI); the relative difference in the physiognomy of the potential natural vegetation distribution and the physiognomy of the current vegetation cover. This index was computed using five different land cover data to estimate the physiognomy of the current vegetation cover, viz.,GlobCov, GLC2000, MODIS-IGBP, MODIS-UMD, and the average over these four.
- Units: standardized score between 0 (no influence) and 100 (maximum influence)
- Used for: Figure 1 and Figure 2 in Appendix S3
- Download: Click here 25.9MB
Geographic coverage of the potential natural vegetations
Description: Computed as the percent area protected of potential natural vegetation types by the protected areas (PA) network (GC).
- Used for: Figure 2A main text
- Download: Click here 11.1MB
Description: Computed as the percent area protected of potential natural vegetation types by the more strictly protected PAs of IUCN class Ib-IV.
- Used for: Figure 2B main text
- Download: Click here 11.1MB
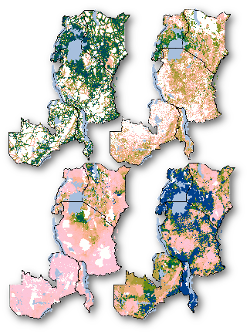
The multivariate environmental similarity maps of each PNV
Description: Shows how similar environmental conditions in each raster cell are to those in the protected areas (PA) located in the PNV.
- Used for: Corresponds Figure 4A in the main text. Note that in the figure the maps of the individual PNVs were combined into one figure.
- Download: Click here 15.9MB
Description: Shows how similar environmental conditions in each raster cell are to those in the PAs of IUCN class Ib-IV.
- Used for: Corresponds Figure 4B in the main text. Note that in the figure the maps of the individual PNVs were combined into one figure.
- Download: Click here 15.7MB